
Finding interesting and significant changes across a biological dataset can be challenging, so having good algorithms that can mine large datasets for differences, and find the statistically significant changes is really important. Within the MarkerView App we have two different options, principal component analysis (PCA) with principal component variable grouping (PCVG) and K-means clustering. PCA-PCVG finds patterns or trends in the data, while K-means finds Euclidean clusters in the data.
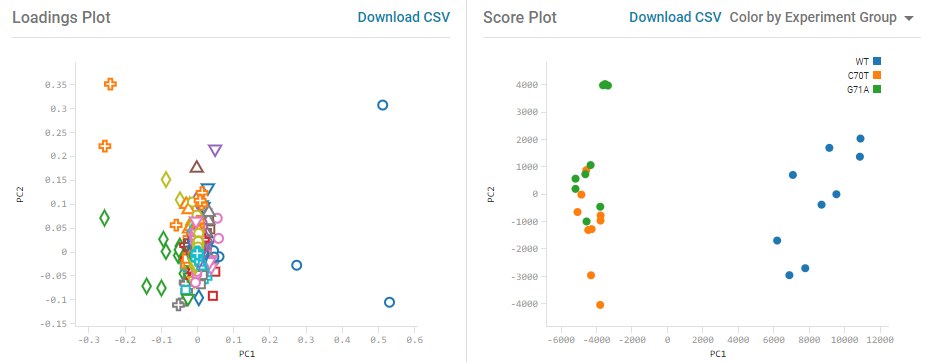
Principal component analysis (PCA) is a data transformation technique that can be used to reduce the complexity of high-dimensional data sets (such as mass spectrometry data) while retaining most of the variation in the data set. The MarkerView app also provides the ability to group these dimensions into a smaller number of groups with similar behavior to simplify visualization, using principal component variable grouping (PCVG). Results are visualized using the Scores and Loadings plots. The Scores plot shows groupings and differences among the samples (the precision of technical replicates, for example). The Loadings Plot shown displays the first 2 principal components (PCs) which typically explain the most important variables causing the separation of the sample groups.
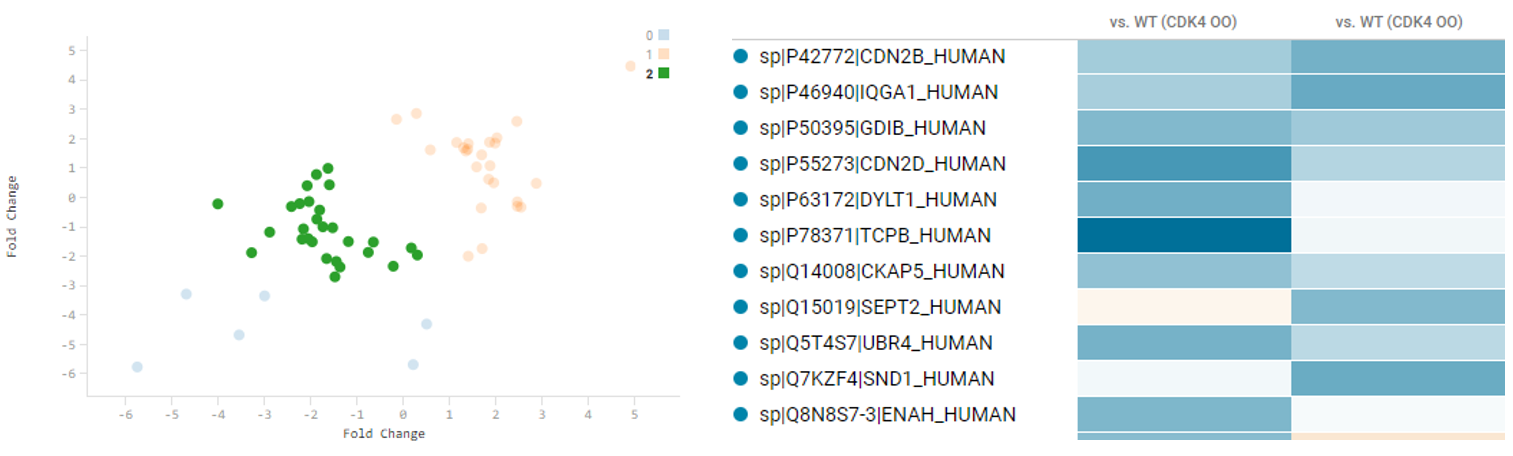
K-means clustering provides another means of identifying groups within a complex dataset. K-means clustering groups similar values (log2 fold change values or area values across samples), within a larger population of data, into smaller groups. This algorithm requires a clustering seed for the number of groups. The algorithm randomly picks k values from the observation values to serve as cluster seeds. Then, all of the observation values are grouped into k clusters based on their proximity to each of the cluster seed values. For each cluster group, a mean observation value is determined. Then, all of the observation values are re-grouped into k clusters based on their proximity to each of the cluster group mean seed values. The algorithm iterates through the cluster group mean seed values and proximity determination until there is no shift in cluster group assignment for each observation.
When you create a new workspace in Bioreviews, and create a new session in the MarkerView App, you can perform an analysis using either the normalized peak areas across the samples, or the computed fold changes from Assembler. Both algorithms are run for every session along with an intersection analysis. As both algorithms are run for each session, we can use the # groups as determined by PCVG to serve as a good estimate for the cluster seeds to start.
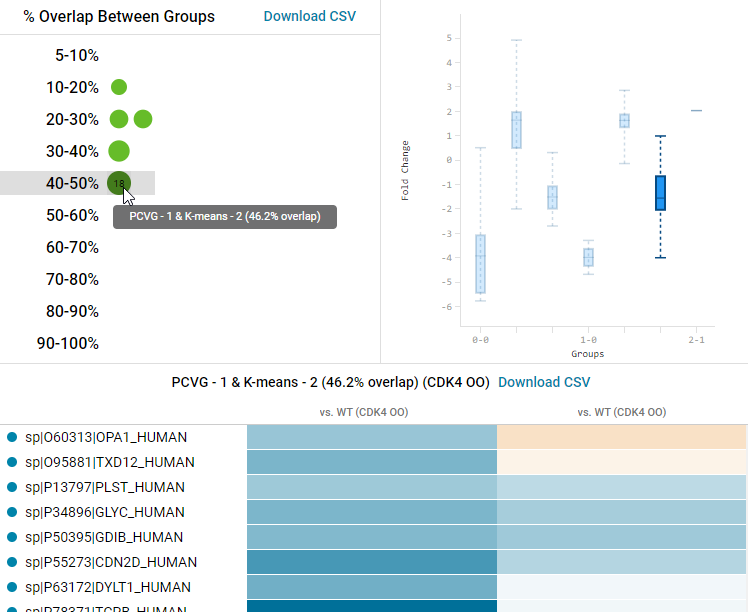
An Intersection Analysis is also performed to determine the degree of overlap between features within groups found by PCA-PCVG clustering analysis and groups found by K-means clustering analysis. This technique is useful for cross-validating the cluster analysis done by each algorithm. The higher the degree of overlap, the more interesting an intersection group might be, because multiple algorithms found similar trends.
RUO-MKT-18-12201-A

 Contact Support
0 Comments