
Principal component analysis (PCA) is a data transformation technique that can be used to reduce the complexity of high-dimensional data sets (such as mass spectrometry data) while grouping samples based on common features.
REMINDER! Principal components are linear combinations of the original dimensions (variables) that account for variance in the data. Principal component scores are calculated from the coefficients (eigenvectors) corresponding to each dimension. The coefficients indicate the relative weight of each variable in the component.
To interpret each principal component, we need to examine the magnitude and direction of coefficients of the original variables. The larger the absolute value of the coefficient, the more important the corresponding variable is in calculating the component.
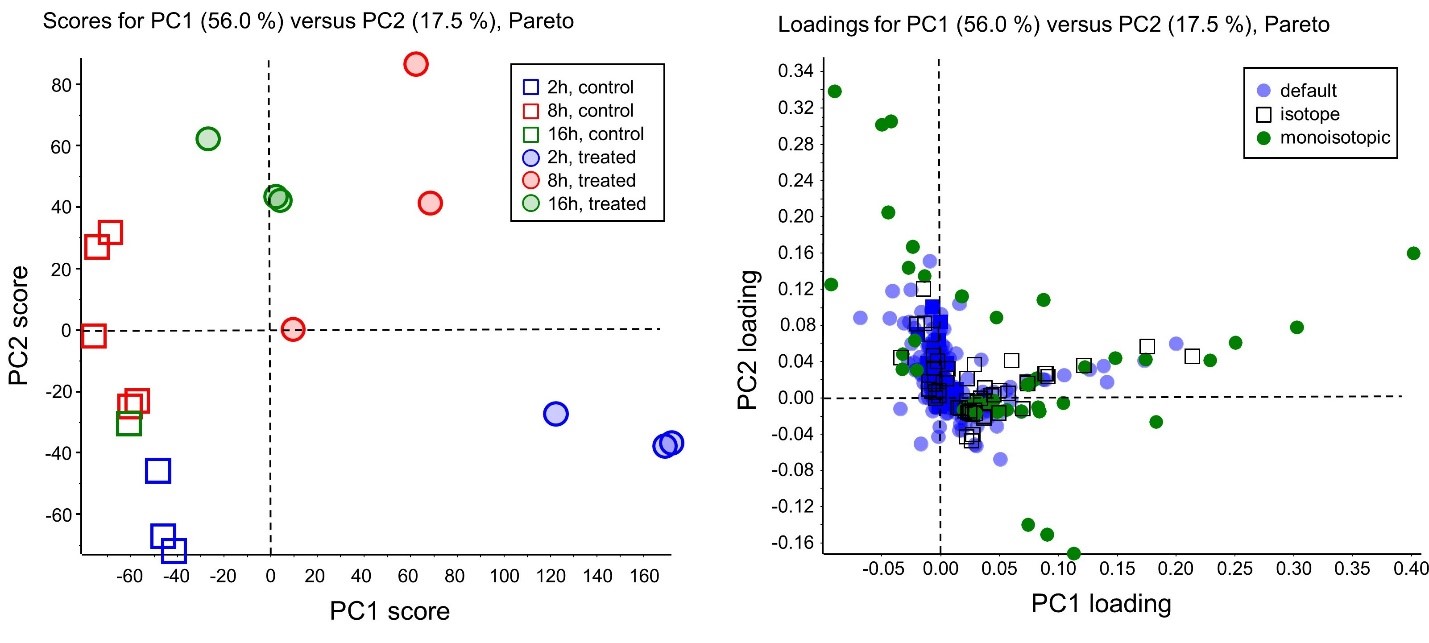
The Scores plot (left) shows groupings and differences among the samples, for example the precision of technical replicates. The Loadings Plot (right) displays the dimensions that are causing the separation; dimensions with higher loadings values are generally more significant for the separation. Let’s examine each plot in more detail below.
The Scores plot
The Scores plot graphs the scores of PC2 versus the scores of PC1. Because principal components are calculated in order of the amount of variance they explain, PC1 and PC2 should account for most of the variance in the data, and we can use the Scores plot to detect clusters, outliers, and trends in the data. Note that you can also visualize the other PCs (PC3, PC4… etc.). This can be useful when the variance between the experimental groups is smaller than the within-group variance.
During PCA the data is typically scaled to correct the responses for individual samples (known as “normalization”, discussed here), and to adjust the relative importance of the different dimensions. Pareto scaling is a technique particularly useful for mass spectrometry data, because larger, more intense peaks (which we assume will generally have better signal-to-noise ratio), will be assigned greater weighting than smaller peaks.
When interpreting the axes on the PCA Scores plot, the units are generally considered to be arbitrary, or unit-less, and are a representation of variance in the sample population. Assuming a normal data distribution, we expect the points to be randomly distributed around zero. However, groupings of data on the plot might indicate two or more separate distributions in the data e.g. treated versus control samples. PCA is unsupervised, in that it does not consider the experimental groups when interpreting the raw data, only the overall variation. Supervised PCA (or PCA-discriminant analysis) can also be performed.
Looking at a Scores plot where Pareto scaling is used, the line at 0 can be considered to reflect the average value of all samples. Scores with close-to-average values appear at the origin of the Scores plot, and scores farther out are either outliers or naturally extreme observations. The more closely together particular samples cluster in the Scores plot, the more they are similar. Taking our example from above, an ideal situation would be when the treated samples are grouped closely together, the control samples are grouped closely together, and when these two groups are far apart from each other. In this case, we want to identify the dimensions responsible for this grouping. We can do this with the help of a Loadings plot.
The Loadings plot
The Loadings plot graphs the coefficients of each variable for PC1 versus the coefficients for PC2. We can use the Loadings plot to identify which dimensions have the largest effect on each component. The axes of the Loadings plot are also unit-less, and can range from -1 to 1 (because, during PCA, eigenvectors are normalized to an absolute value of 1). Loadings close to -1 or 1 indicate that the dimension strongly influences the component; while loadings close to 0 indicate that the dimension has a weak influence on the component.
Pareto scaling causes correlated variables to lie on straight lines that pass through the origin. Correlated peaks, for example, isotope peaks, adducts, fragments or multiply-charged variants, will lie on a straight line through the origin. Thus, we are often interested in dimensions that lie at the extremes of the Loadings plot.
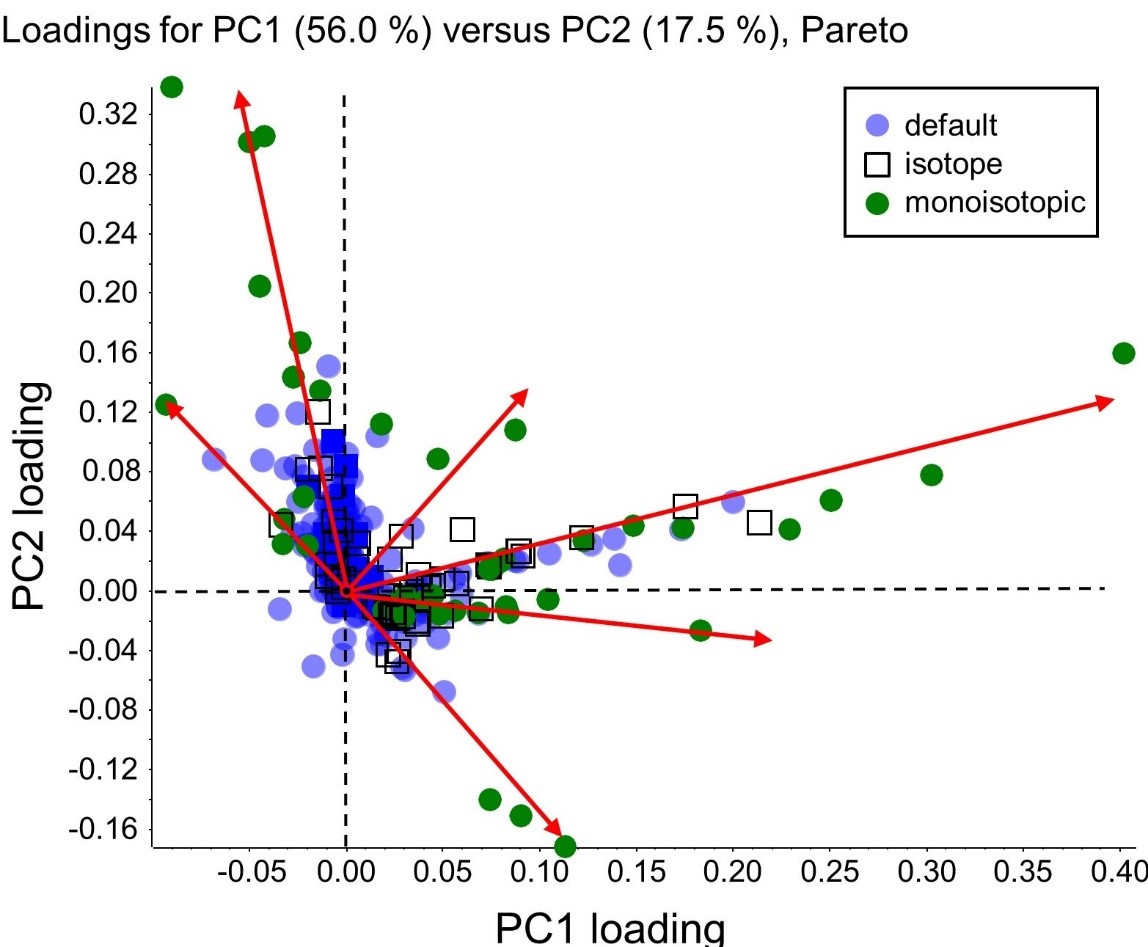
In this example we can see several families of correlated variables. The peaks will often be in intensity order along this line with the most intense generally farthest from the origin. Sometimes a less intense peak might be farther away from the origin if this variable has more variance than a more intense peak. Note that in many cases correlated variables are removed before performing PCA, but here their presence helps to confirm that the observed behavior is real and not random. Especially for untargeted analyses, it also provides a way to determine peaks that are related to the same compound, since these will be correlated.
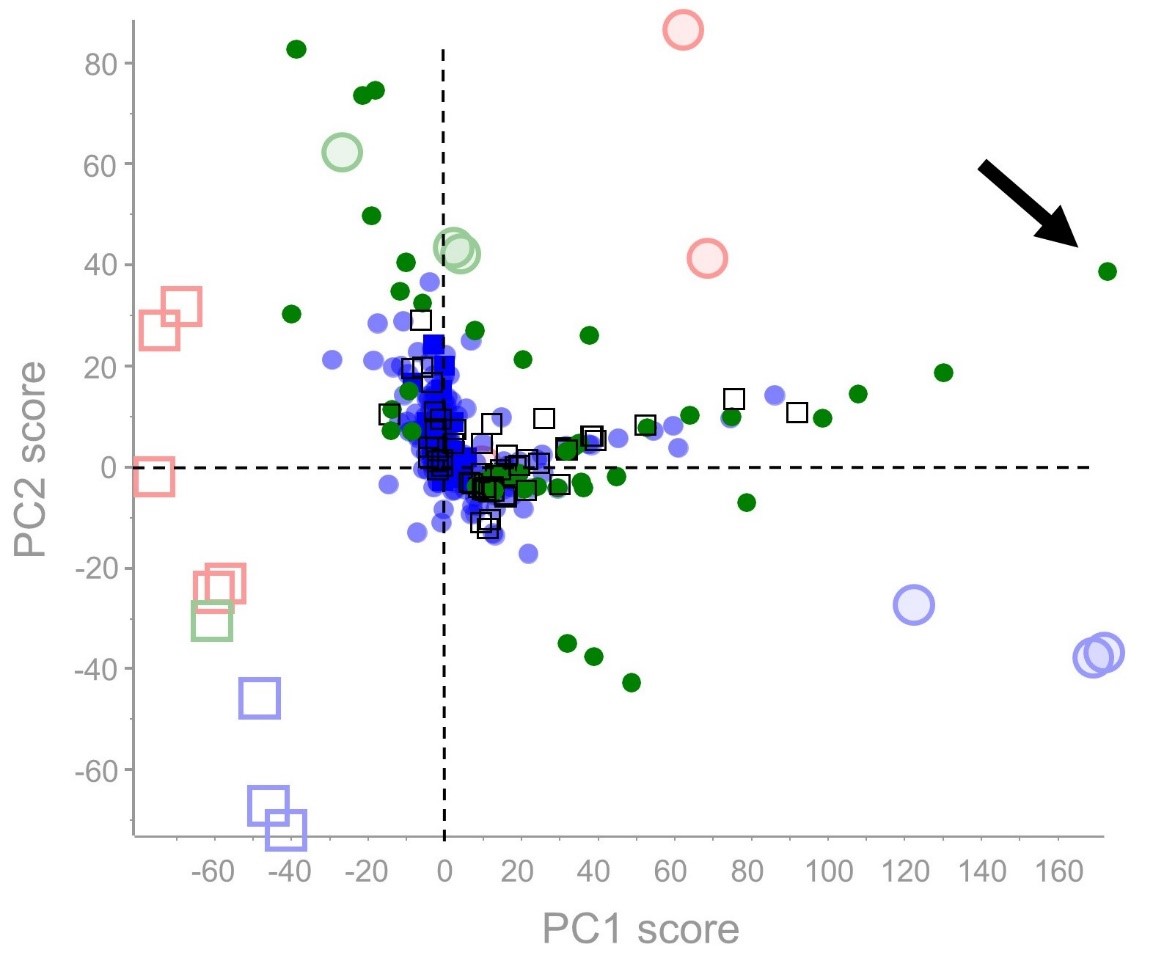
The quadrants of the Scores plot and Loadings plot are closely related. It can be useful to think of the Loadings and Scores plots superimposed on each other. So, for samples that sit towards the right side of the Scores plot, the analytes that influence this group of samples can be found towards the right side of the Loadings plot (marked by the arrow).
Often there are several dimensions that are found to have substantial influence over a specific principal component; these are found farthest from the center of the plot and are often correlated in their abundance in the sample population data. To learn more about how to find correlated analytes on the Loadings plot, please read the post on principal component variable grouping (PCVG).
Let’s revisit our example.
When we select the most extreme dimension indicated by the black arrow on the Loadings plot, we can generate a profile plot for our 18 samples. It is clear that this variable (m/z 323.22 at 13.0 min) is absent from the vehicle control samples and exhibits a dose-response.
RUO-MKT-18-12137-A

 Contact Support
0 Comments