
With bottom-up proteomics, we quantify peptides in the sample and then infer the protein level quantitation from that data. However, due to post-translational modifications, different protein isoforms, etc. we don’t always expect that all peptides associated with the same protein will exhibit the same behavior. The algorithm in the Assembler app incorporates this complexity of protein quantitation when analyzing SWATH acquisition data from digested proteomics samples to determine changes in protein expression.
After normalization, the next step is to compute the protein fold changes between the experimental groups. The output from the normalization step is a normalized peak area feature table for every sample along with reproducibility metrics. The first step in the computation is to take the normalized peak area feature table and compute a weighted average peak area feature table for each experiment group, using the intensity of the fragment ions across all replicates (biological and technical) and the MLRw reproducibility weights. Next, a table of weighted peptide level ratios is computed between each experimental group and the control by computing the fragment ion ratios, determining the appropriate weights of each based on S/N metrics. A peptide confidence is also computed using weighted average of the transition level MLRw and using median peptide S/N and median peptide MLR as weights. At this point, we now have a peptide ratio and confidence for each experimental condition (relative to control) for all peptides from the SWATH acquisition data.
The next step is to compute protein level fold changes, both in the up and down directions. First all the peptides showing an up-regulation between the experimental condition and the control are assembled and the median ratio of all of these is computed. A confidence in this up fold change is computed and is a function of both the reproducibility (MLRw weight) of all peptide up measurements and the # of peptides in the up direction, as well as the S/N weight of the up fold change peptide measurements. The same process is used to compute the protein down fold change and confidence, using all the peptides with negative ratios. The final reported protein fold change reported is fold change direction with that has the maximum confidence. The additional statistics are also reported for this protein level fold change. The default setting for the protein confidence filter is 75% confidence.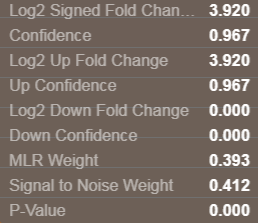
In summary, the Assembler application provides robust sample normalization, together with weight-modelling of measurement reliability, to provide an unbiased detection of differentially expressed peptides and proteins between experimental conditions and a control condition.
More information on the fold change computations can be found in the publication: Lambert et al. (2013) Nature Methods, 10, 1239-1245.
RUO-MKT-18-6401-A

 Contact Support
0 Comments