
To assess the statistical accuracy of library identifications, the Extractor App located within the Metabolomics App in the OneOmics suite features built-in false discovery rate (FDR) scoring for processing metabolomics data. The FDR scoring follows a target-decoy approach, where decoys are generated directly from the library used for data processing. The following criteria are used for the selection of decoy analytes, which consist of both precursor ions and fragment ions.
Selection criteria for decoy precursors
The selection of a decoy precursor depends on both the target precursor and the width of the SWATH acquisition window used during data collection. All decoy precursors are chosen to be within the mass range of the SWATH acquisition window that the target belongs to.
Figure 1 describes the acceptable (green) and unacceptable (orange) m/z value ranges for decoy precursors if the SWATH acquisition window width was >8 Da during data acquisition. As illustrated in Figure 1, an area of ±4 Da around the target precursor is excluded from decoy selection to avoid isotope effects. An area of 1 Da is also excluded at the end of the SWATH Acquisition window to avoid overlap with the next window. Decoy precursors can be selected from the green region in Figure 1, and an integer value is selected for the final m/z value.
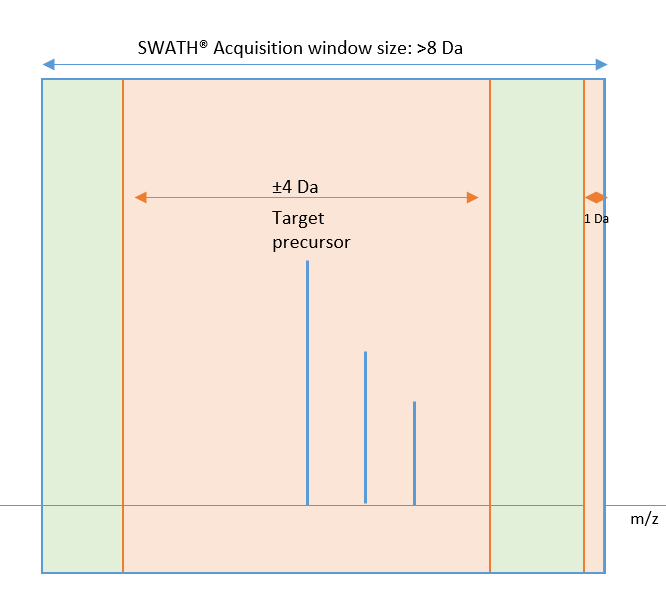
Figure 1. If the SWATH acquisition window width was >8 Da during data acquisition, an area of ±4 Da around the target precursor is excluded from decoy selection to avoid isotope effects, and an area of 1 Da is excluded at the end of the window to avoid overlap with the next window.
If the SWATH acquisition window size is ≤8 Da, the decoys are selected in a way that locates them in a valley between isotopes. For example, for a precursor with 1+ charge, the list of potential decoy masses would start at ±0.5 Da from the target and then step by 1 Da. For a precursor with 2+ charge, the list of potential decoy masses would start at ±0.25 Da and then step by 0.5 Da.
The green areas in Figure 2 indicate where decoy analytes can be selected following these criteria, and the orange indicates unacceptable areas. Looking at the target precursor, the orange area surrounding it is ±1/(2z) Da from the mass of the target. The final decoy analyte will be located within an increment of 1/z from the boundary of an orange zone. Note that there is also an orange exclusion zone of 1 Da at the end of the SWATH acquisition window to avoid window overlap.
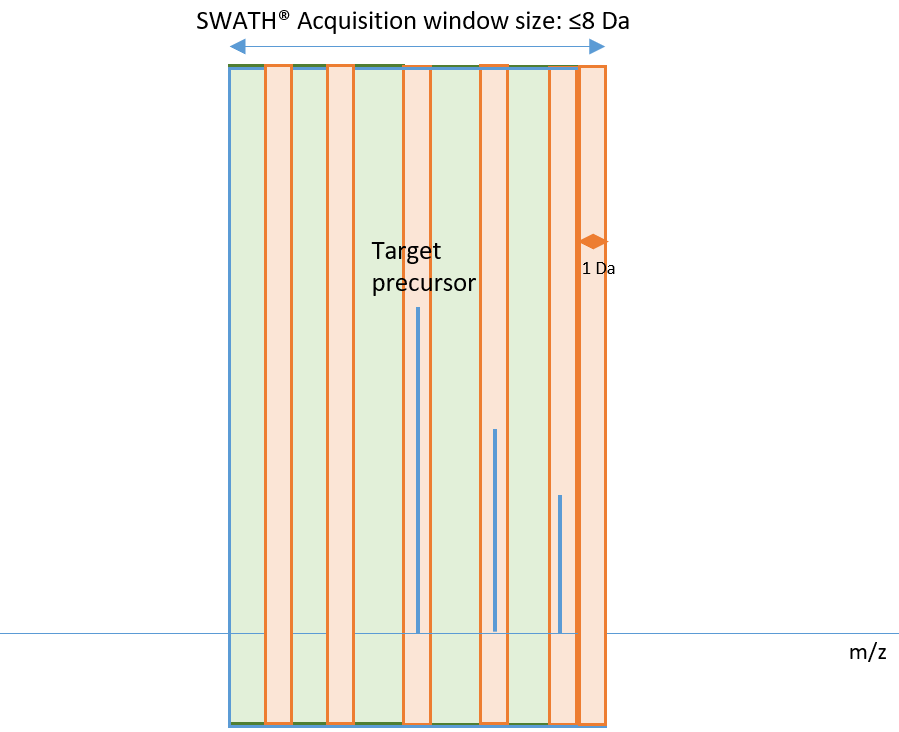
Figure 2. In this example, where the SWATH acquisition window width is ≤8 Da, the orange area surrounding the target precursor is ±1/(2z) Da from the mass of the target. The final decoy analyte will be located within an increment of 1/z from the boundary of an orange zone.
Selection criteria for decoy fragments
The decoy fragment selection process begins with reading all fragment m/z values in the library and then filtering out fragments that are within ±0.1 Da of target fragment m/z, target precursor m/z and decoy precursor m/z. From the remaining pool, decoy fragment m/z values are selected that are within ±5 Da of the target fragment. If the decoy pool is not equal to the target pool, an unselected target fragment m/z value that is lower than the decoy precursor value is randomly picked.
Figure 3 illustrates an example decoy fragment selection where the decoy m/z value for fragment 1 will be a randomly selected fragment from the library that falls in the green zone around target fragment 1, repeating for all fragments up to target fragment n. If there is nothing in the library inside the green zone for a particular fragment, a decoy fragment of m/z that is less than the precursor m/z will be randomly chosen from the library. The orange areas in the diagram indicate exclusion zones.
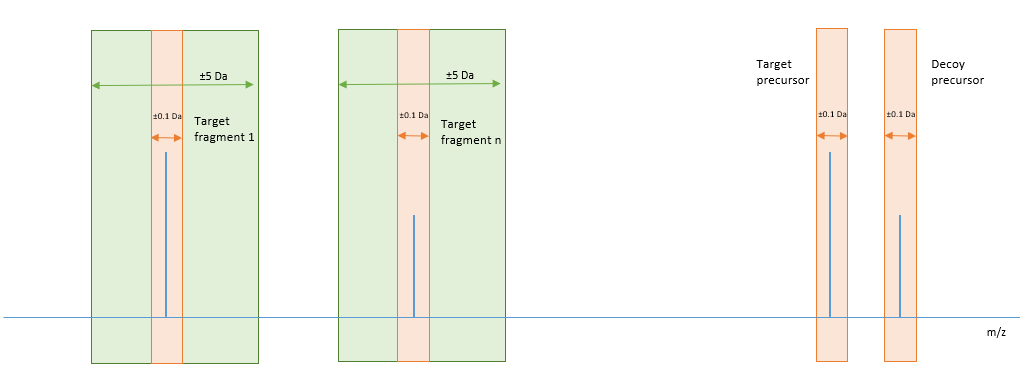
Figure 3. In this example, the decoy m/z value for fragment 1 will be randomly selected from the green zone around target fragment 1, repeating for all fragments up to target fragment n. If there is nothing in the green zone for a fragment, a decoy that is less than the precursor m/z will be randomly chosen.
Upon decoy selection, an FDR analysis is performed in which targets and decoys are scored according to chromatographic and spectral components and ranked in the Extractor App (for more information on the Extractor App, please see the Cloud talk on Extractor in the Metabolomics App).
The FDR is then computed by taking 2 times the number of decoys in the list and dividing by the total (or position of the target in the list). FDR metrics, including the number of analytes that pass a 1% FDR filter in each sample, can be viewed in the Analytics App within the Metabolomics App.
RUO-MRK-18-13219-A

 Contact Support
0 Comments