When performing LC-MS quantitation, there are numerous sources of experimental variance that can confound the quality of your results (variation in the starting amount of sample, variation in the LC-MS measurements, etc.). Having a robust normalization strategy that can be applied to minimize the differences due to experimental artifacts between samples can provide an improvement in resulting data quality. It is critical to choose a normalization strategy that makes sense for the type of data to be analyzed, and you must be careful not to introduce bias. The informatics team at SCIEX investigated a number of normalization strategies1 for use with SWATH acquisition data, and has found that the MLR (Most Likely Ratio) normalization provided the best results quality and robustness for a broad range of SWATH acquisition data files. This algorithm works best for normally distributed data where it can be assumed that the bulk of analytes are not changing. The MLR method also requires a minimum of around 500 fragments/transitions, or roughly 80-100 peptides for best results.
Normalization is performed using the Assembler application (when processing proteomics data, an additional fold change computation is also performed). The normalization starts at the lowest level of the replicates (the biological and technical replicates together) within an experimental group. The algorithm determines the ratio for each feature between each pair of replicates within the group which creates a ratio histogram for each sample (matrix of comparisons within a single experimental group).

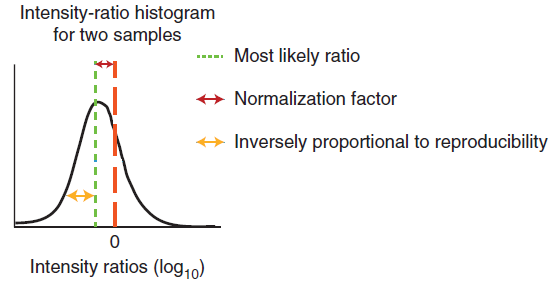
Next, a sample pair is selected which has its ratio histogram with the centroid closest to zero; then the ratio histograms using the same sample in the denominator are aligned. The distance of the centroid of each sample ratio histogram from the selected ratio histogram is the normalization factor for that sample.

Next, these normalization factors are used to compute a normalized peak area feature table for each sample. In addition, the MLR weight (MLRw – a measurement of reproducibility) for each feature is computed for each sample which provides a weighting for that feature. This is computed by taking the inverse of the sum of the distances from the MLR for each feature within the replicate set (yellow in the first figure). Because variance should be minimal within a set of replicates, the larger this distance the less weight this feature should get.
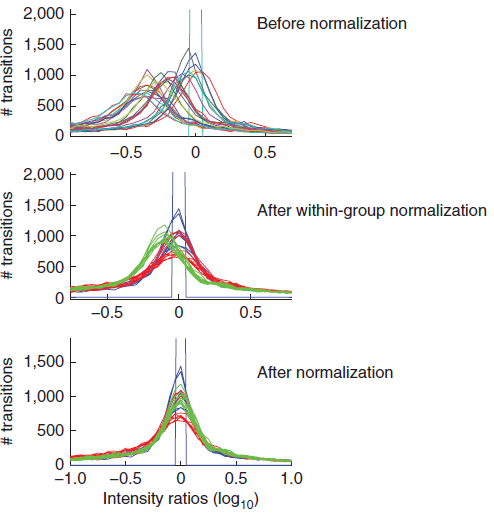
So for the first round of normalization at the biological or technical replicate level, the output is a normalized peak area table for all features and a reproducibility factor that represents the error in each measurement. Basically the ratio histograms within each experiment group have been aligned (Figure 2 middle pane).
The exact same normalization procedure is now repeated between the experimental groups. In the end you have a set of normalized peak area tables at the fragment ion level for all samples that should now be on the same scale such that downstream computations can be made with minimized error (all histograms have been aligned, second figure – bottom).
1 Lambert et al. (2013) Nature Methods, 10, 1239-1245 for more information on the normalization strategy.


 Contact Support
0 Comments