Results workspaces in the OneOmics suite contain a variety of figures, all available for download as SVG (scalable vector graphic) files. To download your figures, select the orange arrow icon located in the upper right-hand corner of each plot. Download will immediately begin on your computer and an SVG file will be available for use.
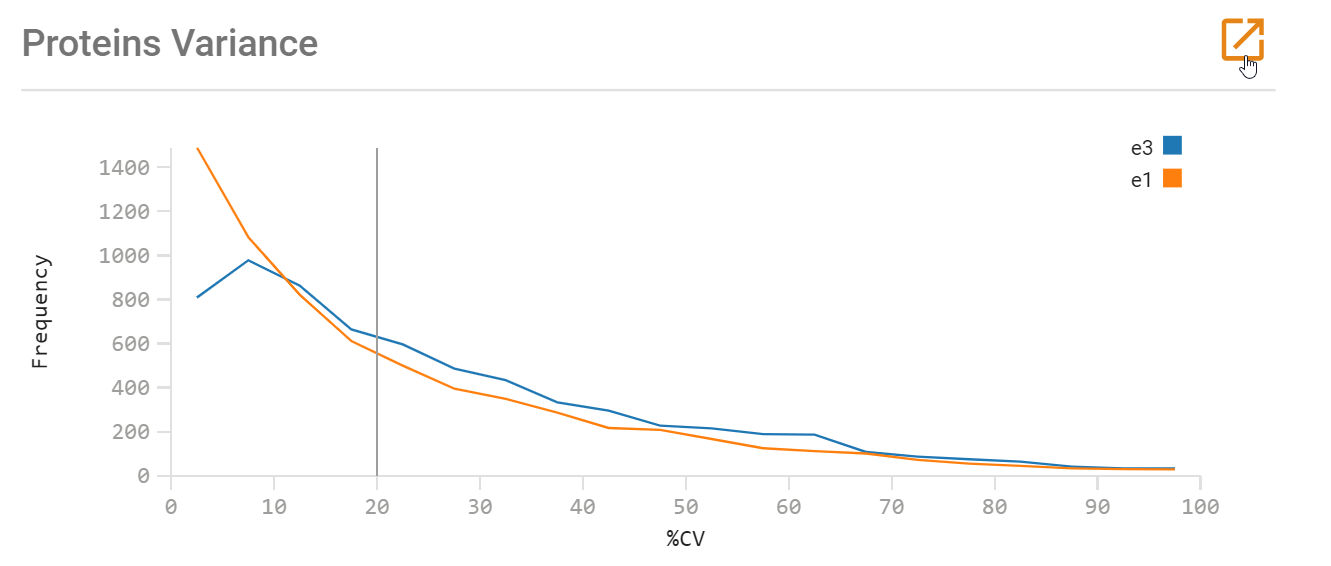
After download, it might be desirable to edit the visual appearance of the figure, such as adjusting the color and thickness of the axes and changing the font of the text labels. SVG files are editable in applications such as Adobe Illustrator, Inkscape, and Microsoft PowerPoint. This post will describe basic figure editing in Microsoft PowerPoint. For more information, please see https://support.microsoft.com/en-us/office/edit-svg-images-in-microsoft-office-365-69f29d39-194a-4072-8c35-dbe5e7ea528c.
To begin editing the visual appearance of your figure, click the name of the SVG file in your Downloads folder and drag it directly into a PowerPoint slide. You will now see the figure in PowerPoint. Repeat this procedure so that you have two slides containing the figure. One slide will be left untouched as the original figure for reference, with editing taking place on the second slide.

To begin editing, right-click the figure and select Convert to Shape.
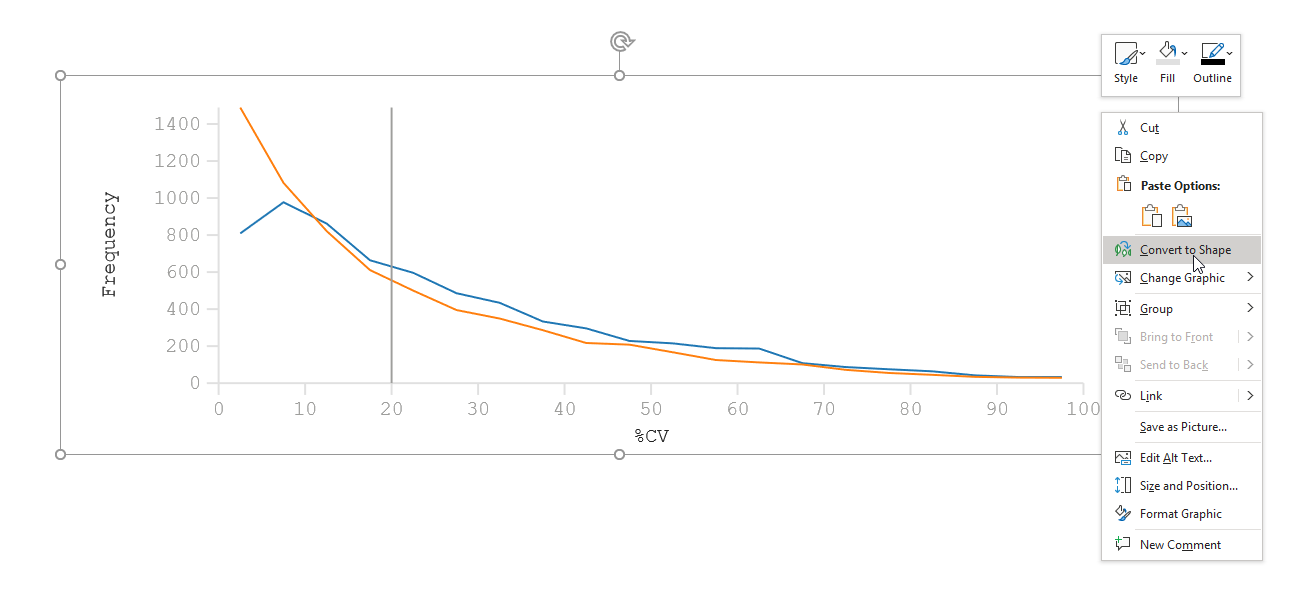
The text associated with the figure will be removed, leaving only the image. Next, right-click the figure and select Group > Ungroup.
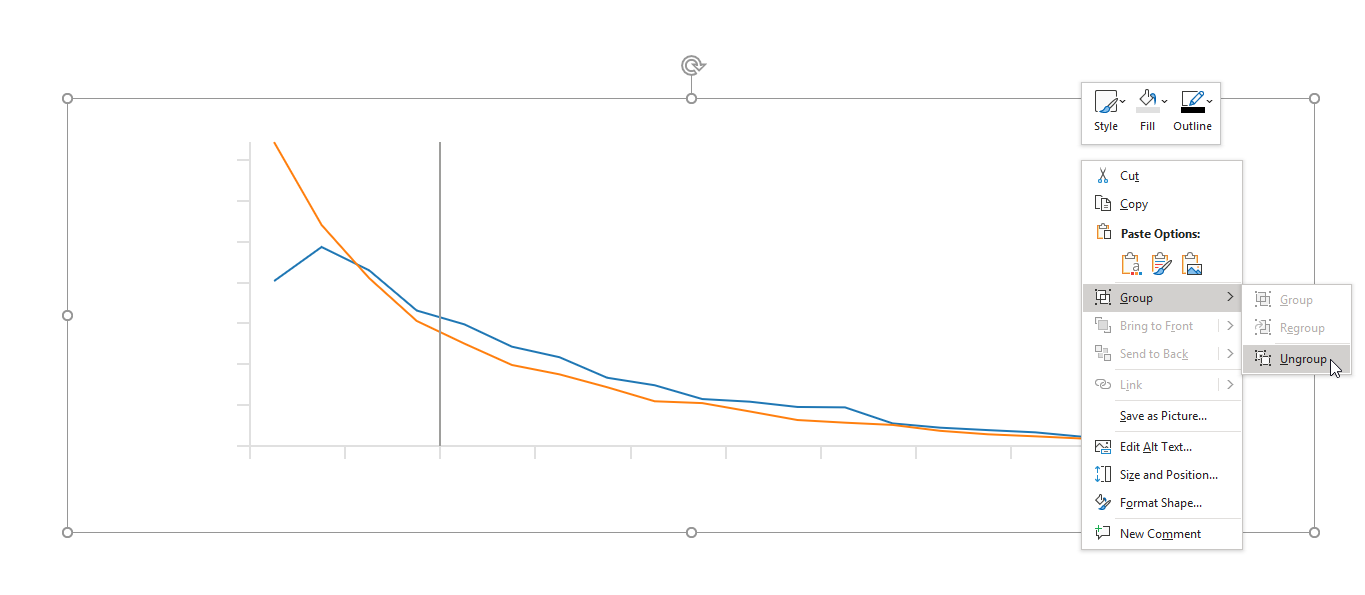
All of the elements of the figure, including the tick marks, axes and lines will now be editable as shapes. For example, you can adjust the thickness and color of the axes to your preferences in Shape Format by selecting the axis and then updating the color and line weight.
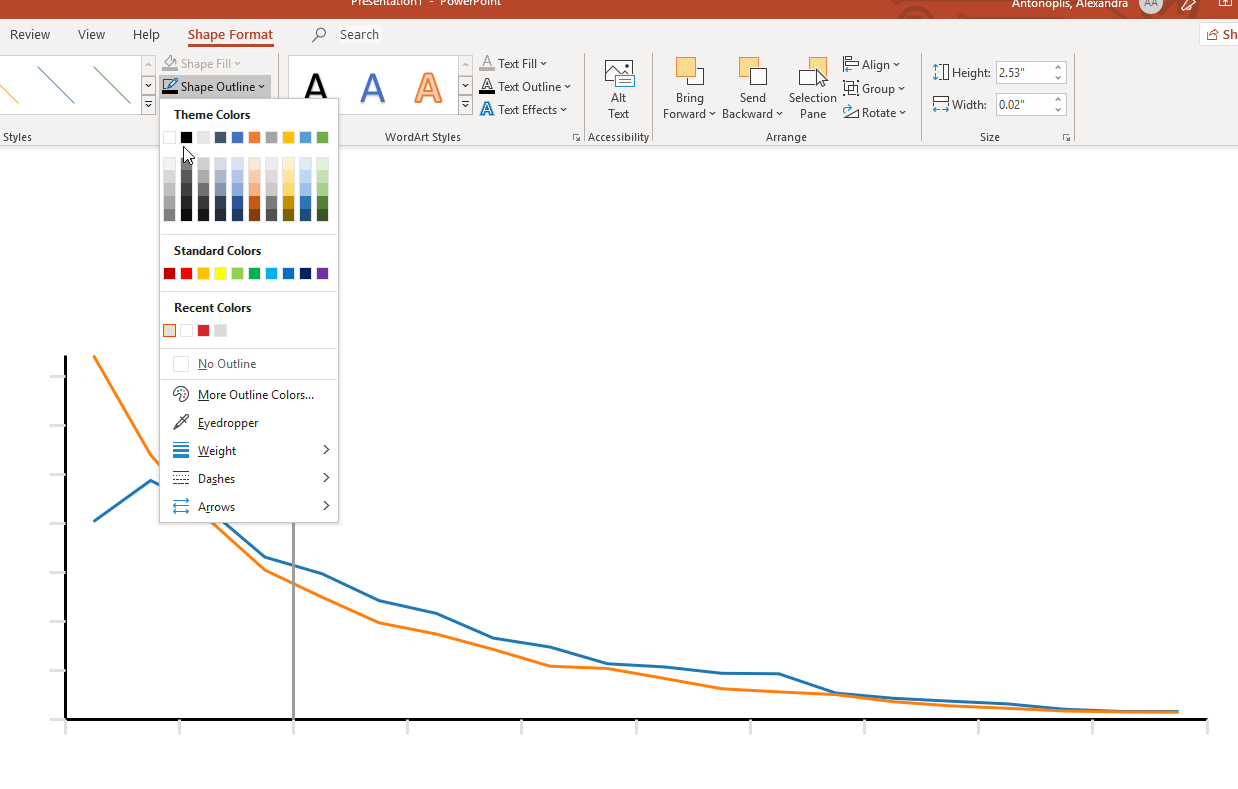
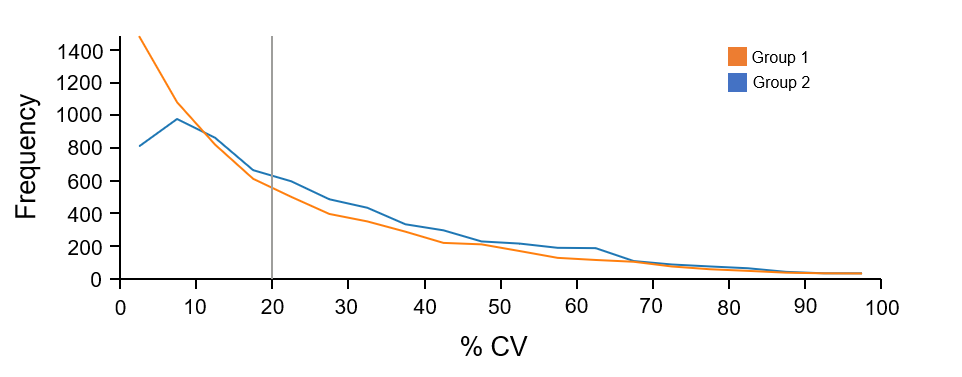
Take care to just select the shape and recolor, and not to move the shape(s) to new locations in the PowerPoint slide. An example of an updated figure is included below, where the color of the axes and plot lines were adjusted. Using text boxes, the font color and size of the axes labels were also changed, and a figure legend was added. You can now save the updated figure for use in your presentations.
RUO-MKT-18-12200-B


 Contact Support
0 Comments