
To obtain the best, most reproducible results using the Echo MS system, it is important to select the best solvent for your analyte and matrix and to ensure the flow rate is optimized for your solvent. Please review this flow rate optimization community post to calibrate your system to methanol for the system suitability test.
Materials needed:
- LC-MS/MS-grade methanol
- Essential LC-MS Performance Kit – Small Molecule Pharma (PN: 5056816)
Sample preparation
- Prepare the small molecule pharma mix to a final concentration of 1 µg/mL in 20 mL of a 10:90, methanol/water solution
- Be sure to prepare this solution in plastic, as erythromycin sticks to glass
- For preparations in a 384-well plate, fill each well with 45 µL of sample
- For preparations in a 1536-well plate, fill each well with 5 µL of sample
Create MS method
- Open a new MS Method within SCIEX OS software
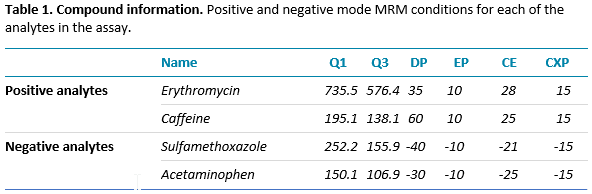
- Copy and paste the MRM information listed in Table 1, below, into the SCIEX OS software MRM table
- Different samples require analysis using either positive or negative mode. Create 2 separate methods to test samples in each polarity.
- Erythromycin and caffeine are analyzed in positive mode
- Sulfamethoxazole and acetaminophen are analyzed in negative mode
- Save the MS Method
- Users are encouraged to use the Guided MRM optimization function to reoptimize these compounds
Create AE method
- Open a new AE Method within SCIEX OS software
- Select AQ for Fluid Class
- Enter the optimized system flow rate
- Set the ejection volume to 1 droplet or 2.5 nL
- Set the Additional Delay to 500 ms
- Save the AE Method
Data acquisition
- Create a batch for the appropriate plate type (384-well or 1536-well plate).
- Select a sample to be a marker well.
- Submit the batch. Press Start if the Queue is not already active.
Data analysis
- Open Analytics in SCIEX OS software
- Click Projects and select Project default settings.
- Select Summation as the Integration algorithm.
- Click Results and select New.
- Select the data files to be used for analysis. Do not select the unsplit data file.
- Under the option to Select a processing method, Click New to create a processing method.
- Click the Components tab and ensure the MRM transitions are correct.
- Click the Integration tab and ensure that the settings for peak integration are acceptable.
- Gaussian Smooth Width is recommended to be set to 1.0 points
- Click Save and enter a name for the new quantification method.
- Click Process to generate the results table.
- Review the data to determine whether they meet quality standards.
- For a 384-well or 1536-well plate, the %CV for peak areas should be less than 10%
RUO-MKT-18-14212-A
0 Comments