

 Read Time: 2 minutes
As an ever-expanding group of chemicals, per- and polyfluoroalkyl substances (PFAS) require novel techniques to monitor their current and historical presence in the environment. Concerns over exposure to PFAS chemicals continue to grow, with some having known toxic characteristics and the potential effects of others remaining unknown.1 In addition, while PFAS are one of the most persistent synthetic chemicals to date, most of them hardly degrade in the environment.2 So, how long do traces of PFAS last in our environment? Two tools used to help answer this question are active samplers and passive samplers.
Active samplers vs. passive samplers
Traditionally, persistent organic contaminants in the air are measured using high-volume active samplers, which typically sample more than 1,500 cubic meters (m3) of air over a 24-hour period.3 However, since these types of samplers are powered by electricity, active sampling becomes an impractical approach when testing in remote regions and rural areas. Also, active samplers only provide a snapshot from a short period of time (usually 1 day), and it can be difficult to get historical snapshots from past contaminant levels.
For looking at longer periods of time (weeks to months), scientists have been using passive samplers —including organic matter such as soils and artificial media such as polyurethane foam (PUF) disks—to get a time-integrated sample when measuring for organic contaminants.4 Excellent examples of passive sampling in action can be found in the work done by the Global Atmospheric Passive Sampling (GAPS) Network, which has been monitoring chemicals such as PFAS, flame retardants, polychlorinated biphenyls (PCBs) and pesticides around the world since 2005.5,6 Passive samplers can also overcome the difficulties of using active samplers in remote and rural locations.
A glimpse of the past using pine needles
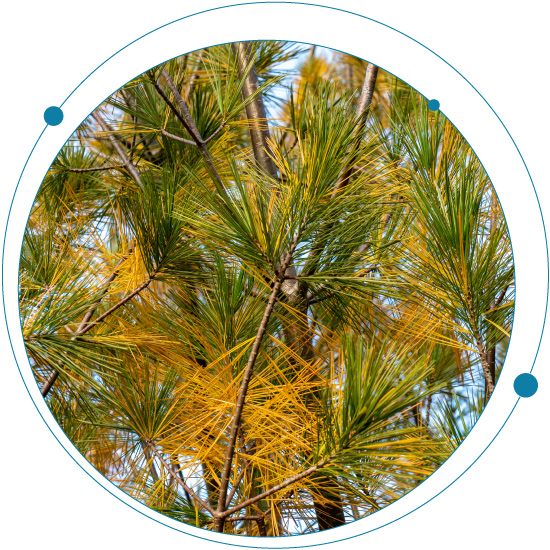
It is often helpful to look at trends over even longer periods of time (years) using historical samples. When measuring for PFAS, historical trends can tell us which PFAS were used and when. In a recent study, researchers from North Carolina State University used pine needle samples from 1962 to the present to test for over 70 types of PFAS across six North Carolina counties.7 If you’ve been to North Carolina, you’ll know that pine trees are everywhere, and for this reason they make ideal passive samplers.
During this study, both traditionally monitored legacy perfluoroalkyl acids (PFAAs) and their emerging replacements were identified across the six counties. Of particular interest was that the researchers were able to detect changes in the PFAAs profiles over time, which presumably reflects changes in the types of PFAS manufactured and used in the region.
The path to understanding
Through monitoring PFAS in vegetation, we can determine not only what was in the air, but also how animals and humans may have been exposed. By understanding this exposure, we can ultimately understand the potential risk PFAS pose to humans and the environment.

References
- Sunderland, E.M. et al. A review of the pathways of human exposure to poly- and perfluoroalkyl substances (PFASs) and present understanding of health effects. J. Expo. Sci. Environ. Epidemiol. 2019, 29, 131–147. https://doi.org/10.1038/s41370-018-0094-1
- De Silva, A.O. et al. PFAS Exposure Pathways for Humans and Wildlife: A Synthesis of Current Knowledge and Key Gaps in Understanding. Environ. Toxicol. Chem. 2021, 40, 631–657. https://doi.org/10.1002/etc.4935
- Queensland Government. High and low volume air samplers. Last updated: 27 March 2017. https://www.qld.gov.au/environment/pollution/monitoring/air/air-monitoring/measuring/samplers
- Alvarez, D. Overview of passive samplers for assessing contaminants in water. National Water Quality Monitoring Council webinar series, April 2019. https://acwi.gov/monitoring/webinars/nwqmc_042019_passive_sampling_seminar.pdf
- Pozo, K. et al. Toward a Global Network for Persistent Organic Pollutants in Air: Results from the GAPS Study. Environ. Sci. Technol. 2006, 40, 16, 4867–4873. https://doi.org/10.1021/es060447t
- Saini, A. GAPS-megacities: A new global platform for investigating persistent organic pollutants and chemicals of emerging concern in urban air. Environmental Pollution (2020), Volume 267, 115416. https://www.sciencedirect.com/science/article/pii/S0269749120361042?via%3Dihub
- Kirkwood, K et al. Utilizing Pine Needles to Temporally and Spatially Profile Per- and Polyfluoroalkyl Substances (PFAS). February 2022. https://pubs.acs.org/doi/abs/10.1021/acs.est.1c06483
*This content does not constitute legal advice. You should consult counsel to assure your procedures comply with applicable law and that it meets your needs.


0 Comments