

 In the field of metabolomics, you typically choose to identify and characterize as many compounds as possible in an unbiased fashion, or screen for a specific set of compounds that are biologically relevant to your research. The beauty of the TripleTOF® System is that you don’t have to choose which path to take. With one acquisition strategy, your data can be processed using either workflow.
This technical note demonstrates the latter workflow for screening a collection of known compounds using the Accurate Mass Metabolite Spectral Library. Here, extracted ion chromatograms are generated for all compounds in the library and confirmed based upon retention time matching, mass accuracy, isotope pattern fit, and MS/MS library searching. The metabolite library contains over 500 metabolites from many compound classes and across a variety of pathways such as the TCA cycle, BCAA degradation/synthesis, glycolysis, and the urea cycle. In this study, a variety of metabolites were identified in urine in both positive ion and negative ion mode analysis.
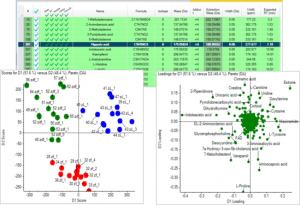
Figure:Transition to MarkerView Software for Statistical Analysis. Generate any principal component analysis (PCA) and drive your biological interpretation faster because results in the loadings plot are already identified (center right). Combine with t-test analysis and rank your significantly differential metabolites by p-value.
A powerful follow-on workflow involves opening the results within MultiQuant™ Software for in-depth quantitative analysis, or MarkerView™ Software for statistical analysis. Within MarkerView, multiple samples can be compared with one another. Because each compound has already been identified with the Accurate Mass Metabolite Spectral Library, biological similarities across samples are immediately apparent in the subsequent loadings plot (as opposed to having m/z-RT pairs).
Additionally, the comparative screening tool in MasterView™ Software enables the comparison of all the samples versus a control. This can be used to screen and quickly capture any major changes compared to a control/baseline sample.


0 Comments