When performing LC-MS quantitation, there are numerous sources of experimental variance that can confound the quality of your results (variation in the starting amount of sample, variation in the LC-MS measurements, etc.). Having a robust normalization strategy that...

What are my normalization options in MarkerView software and when should I use them?
In an LC-MS experiment there are multiple sources of variance that can confound the quality of your results. This variation can be biological e.g. differences between treated and control groups, but can also be non-biological, usually from small variations in...

How does metadata persist from the Analyst software batch into MarkerView software?
Did you know that MarkerView software can pull information directly from the metadata of your sample datafiles that can help with downstream data processing? To facilitate this, when building your batch in Analyst software, make sure to define your experimental groups...

What is the t-test and when should I use it?
A t-test (sometimes called Student’s t-test) is used to determine if the means of two sample groups are significantly different. So, for LC-MS data, we would typically use a t-test to find out if the amount of our variable of interest (protein, peptide, small...

What is principal component variable grouping (PCVG) and how do I use it?
In our previous post we discussed how to interpret the Scores and Loadings Plots produced by PCA. In many cases there are several dimensions that are found to have substantial influence over a specific principal component, and these dimensions are often correlated in...

How do I interpret the output from PCA?
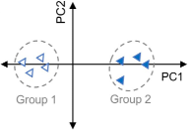
Principal component analysis (PCA) is a data transformation technique that can be used to reduce the complexity of high-dimensional data sets (such as mass spectrometry data) while grouping samples based on common features. REMINDER! Principal components are linear...

What is principal component analysis and how does it work?
When we measure anything, the resulting measurements are often referred to as variables or dimensions. For example, a cube has three dimensions that can be measured: length, width and height. When we measure a complex sample using mass spectrometry (like a proteome,...